sales@gambitcomm.com (603) 889 5100.
OVERVIEW
Download
Pricing
Brochure
Case Studies


Case Studies
- APC - Complete Testing
- APC - QA Process
- Avaya - Sales Demos
- CA - Customer Support
- Cisco - Testing Web & SNMP
- HP - Training Courses
- Pepco - Crisis Simulation
- SITA - Disaster Recovery Procedure
- Xirrus - Wireless App Testing
- Mibtree - NMS Training
- Fed Tech - Management Solutions for Federal customers
- VistaraIT -Large SNMP & CLI data Testing
- Device42 - QA & Support
Tables can be of any size. We are running RMON probe simulations containing tables with more than 10,000 entries. Currently, static tables are simulated, ie. the size of the table does not change.
- The following graphs show MIMIC simulations of the RMON tables for a Agilent Lanprobe from a variety of network management applications.
The above is from the HP Network Node Manager. Here is the same graph as generated by Agilent NetMetrix.
- A similar graph from Castle Rock SNMPc. All three applications query the etherHistoryTable to retrieve the appropriate statistics.
Here is a size distribution graph created by querying the etherStatsTable.
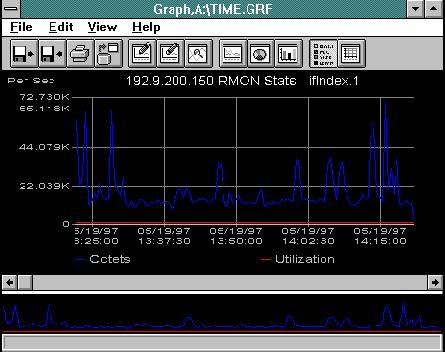
Which we can manipulate at run-time. For example, here we have artificially changed the rates to multiples of 100 / sec in ascending order.
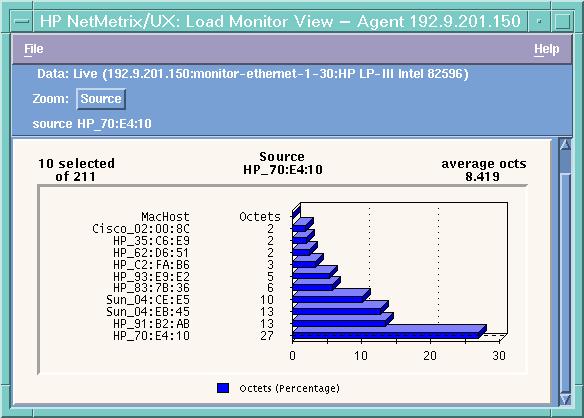
Here is a host traffic distribution graph from a hostTable simulation. Notice we are only showing 10 out of 200+ entries in the table.